In this edition of the Explainers, we look at the Pre-Trade Analytics tools and specifically the Estimated Trading Cost function. This helps traders to understand the expected impact of a larger trade, using different execution strategies. Because market conditions change quickly, even in highly liquid names, the key benefit of the tool is to enable traders to plan their strategies based on up-to-date information.
Pre-Trade Analytics contains other features which we will cover in subsequent Explainers, and you can find the full series of JSE Trade Explorers Explainers in the footer of each screen in the Resources section.

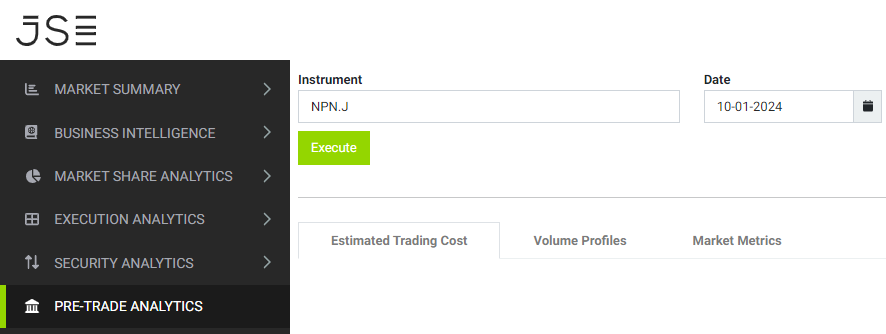
What Is In Pre-Trade Analytics?

JSE Trade Explorer consists of three main functions:
  • Estimated Trading Cost
  • Volume Profiles
  • Market Metrics
These can be accessed under the Pre-Trade Analytics section of the menu where you can select the symbol you want to analyse.

What Is Estimated Trading Cost Analysis?

As a general rule, a trade which is a large proportion of typical daily volume will adversely impact market price during its execution more than a small one will. This price movement is a major component of trading cost. The more aggressive (faster) our trading activity, the more likely we are to encounter such price moves. On the other hand, slow execution may result in poor outcomes during volatile conditions.
We can estimate these costs by using recent volumes and volatility to arrive at an expected trading cost given different rates of participation in the order book.
To help judge the required speed of execution, the Estimated Trading Cost tool allows the user to model different participation rates based on the prior 20 days’ data. Of course, pre-trade analysis only gives you a ‘starting point’ and is based on historical conditions which may be very different from those experienced on trade day, especially in stocks with low liquidity.

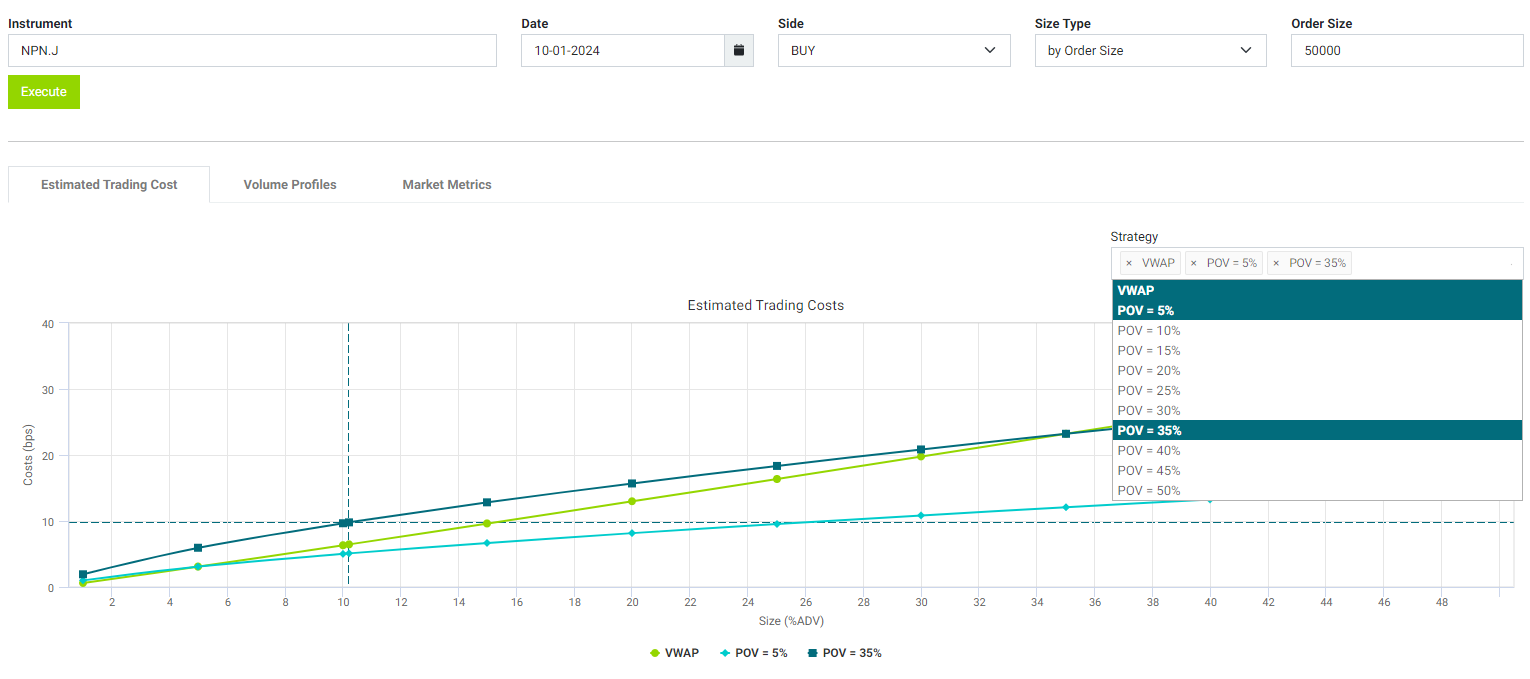
Let’s Take An Example

In the example below, the user has elected to analyse an order to BUY 50,000 NPN.J. They can also select a given % of ADV. The Expected Cost Impact model is then executed, and displays the results based on three default strategies (many more strategies are available as you can see in the drop down):

  • VWAP;
  • Participation Rate of 5% of volume;
  • Participation Rate of 35% of volume.

The JSE Trade Explorer presents the results as the Expected Price Impact in bps (y axis) for a given %ADV (x axis). The dotted ‘cross-hairs’ show that an order for 50,000 shares of NPN.J is approximately 10.2% of ADV and the expected cost of trading at 35% of volume (dark blue line) is around 9.8bps. Meanwhile the expected cost of trading at 5% of volume (light blue line) is around 5bps, while a VWAP strategy (green line) is a little higher. By hovering over the graph with the mouse, the user can see the expected cost for any point on the curves.

The tool also presents the data in a table format for each participation rate (‘POV’ or percentage of volume) that is modelled, at 5% increments up to 50%. Simply select your options from the drop down. Note that the model uses a standard “square root” model which relates volatility and volume to trade size.
By looking at the post-trade Execution Analytics provided in the JSE Trade Explorer (found under the menu item of the same name), the user can relate the outcome of their execution to the pre-trade estimates. For example, the Price Reversion metrics will indicate whether the selected participation rate is in line with the pre-trade expected cost and aid further investigation.

More on Pre-Trade Analytics

In future Explainers, we will cover the tools available to help you look at recent volume and volatility trends and the distribution of liquidity between different categories of liquidity – such as off order book and auction trading.

How To Access the Service

If you are an existing user of the JSE Trade Explorer, please follow this link and login using your existing credentials: https://jse.big-xyt.com/login

If you are a new user, please register for the service by following this link https://jse.big-xyt.com/signup and follow the instructions.

Feedback, Suggestions and Support

Please send feedback, questions or issues to [email protected] or use the form on the “Contact Us” link in the footer of all user views. We would appreciate as much information as possible such as:

  • name of the window,
  • any non-default filter settings,
  • date range,
  • symbol or stock selected.

Leave a Reply

Your email address will not be published. Required fields are marked *