In this edition of the Explainers, we look at the Pre-Trade Analytics tools available within Trade Explorer. Pre-Trade Analytics consists of a suite of metrics and visualisations that help you to investigate the likely implicit cost of a large trade, given different parameters such as recent share price volatility and expected liquidity.
The user is able to simulate a variety of market participation rates and evaluate the resulting expected duration of the trade, expected market impact in basis points and the timing risk due to volatility.
Additional features, such as volume and volatility curves, help you to identify the most liquid and the volatile points of the day based on the recent past performance of the stock in question.
Pre-trade tools are used by sales traders to manage large blocks, as well as by quants and algo developers to feed data into their algorithmic trading engines. For these use cases, an API is available upon request.
What Is In Pre-Trade Analytics?
The JSE Trade Explorer pre-trade module consists of three main functions::
- Estimated Trading Cost
- Volume Profiles
- Market Metrics
These can be accessed under the Pre-Trade Analytics section of the menu where you can select the symbol you want to analyse.

First, select the symbol you wish to analyse. Enter the ‘side’ and the number of shares in the ‘order size’ block before hitting the ‘Execute’ button. The user interface will, by default, display the Estimated Trading Cost tool. In this example, we have selected 100,000 shares to BUY of ANH.J.
Estimated Trading Cost
Estimated Trading Cost is based on an optimised model which uses the participation rate of a trade to estimate the length of time it is likely to be in the market (Duration), the expected impact in basis points and its exposure to price movements based on recent historical volatility.
The higher the participation rate of a trade, the more likely it is to move the market adversely, increasing trading costs. Conversely, a lower participation rate may result in the trade suffering from negative price movements.
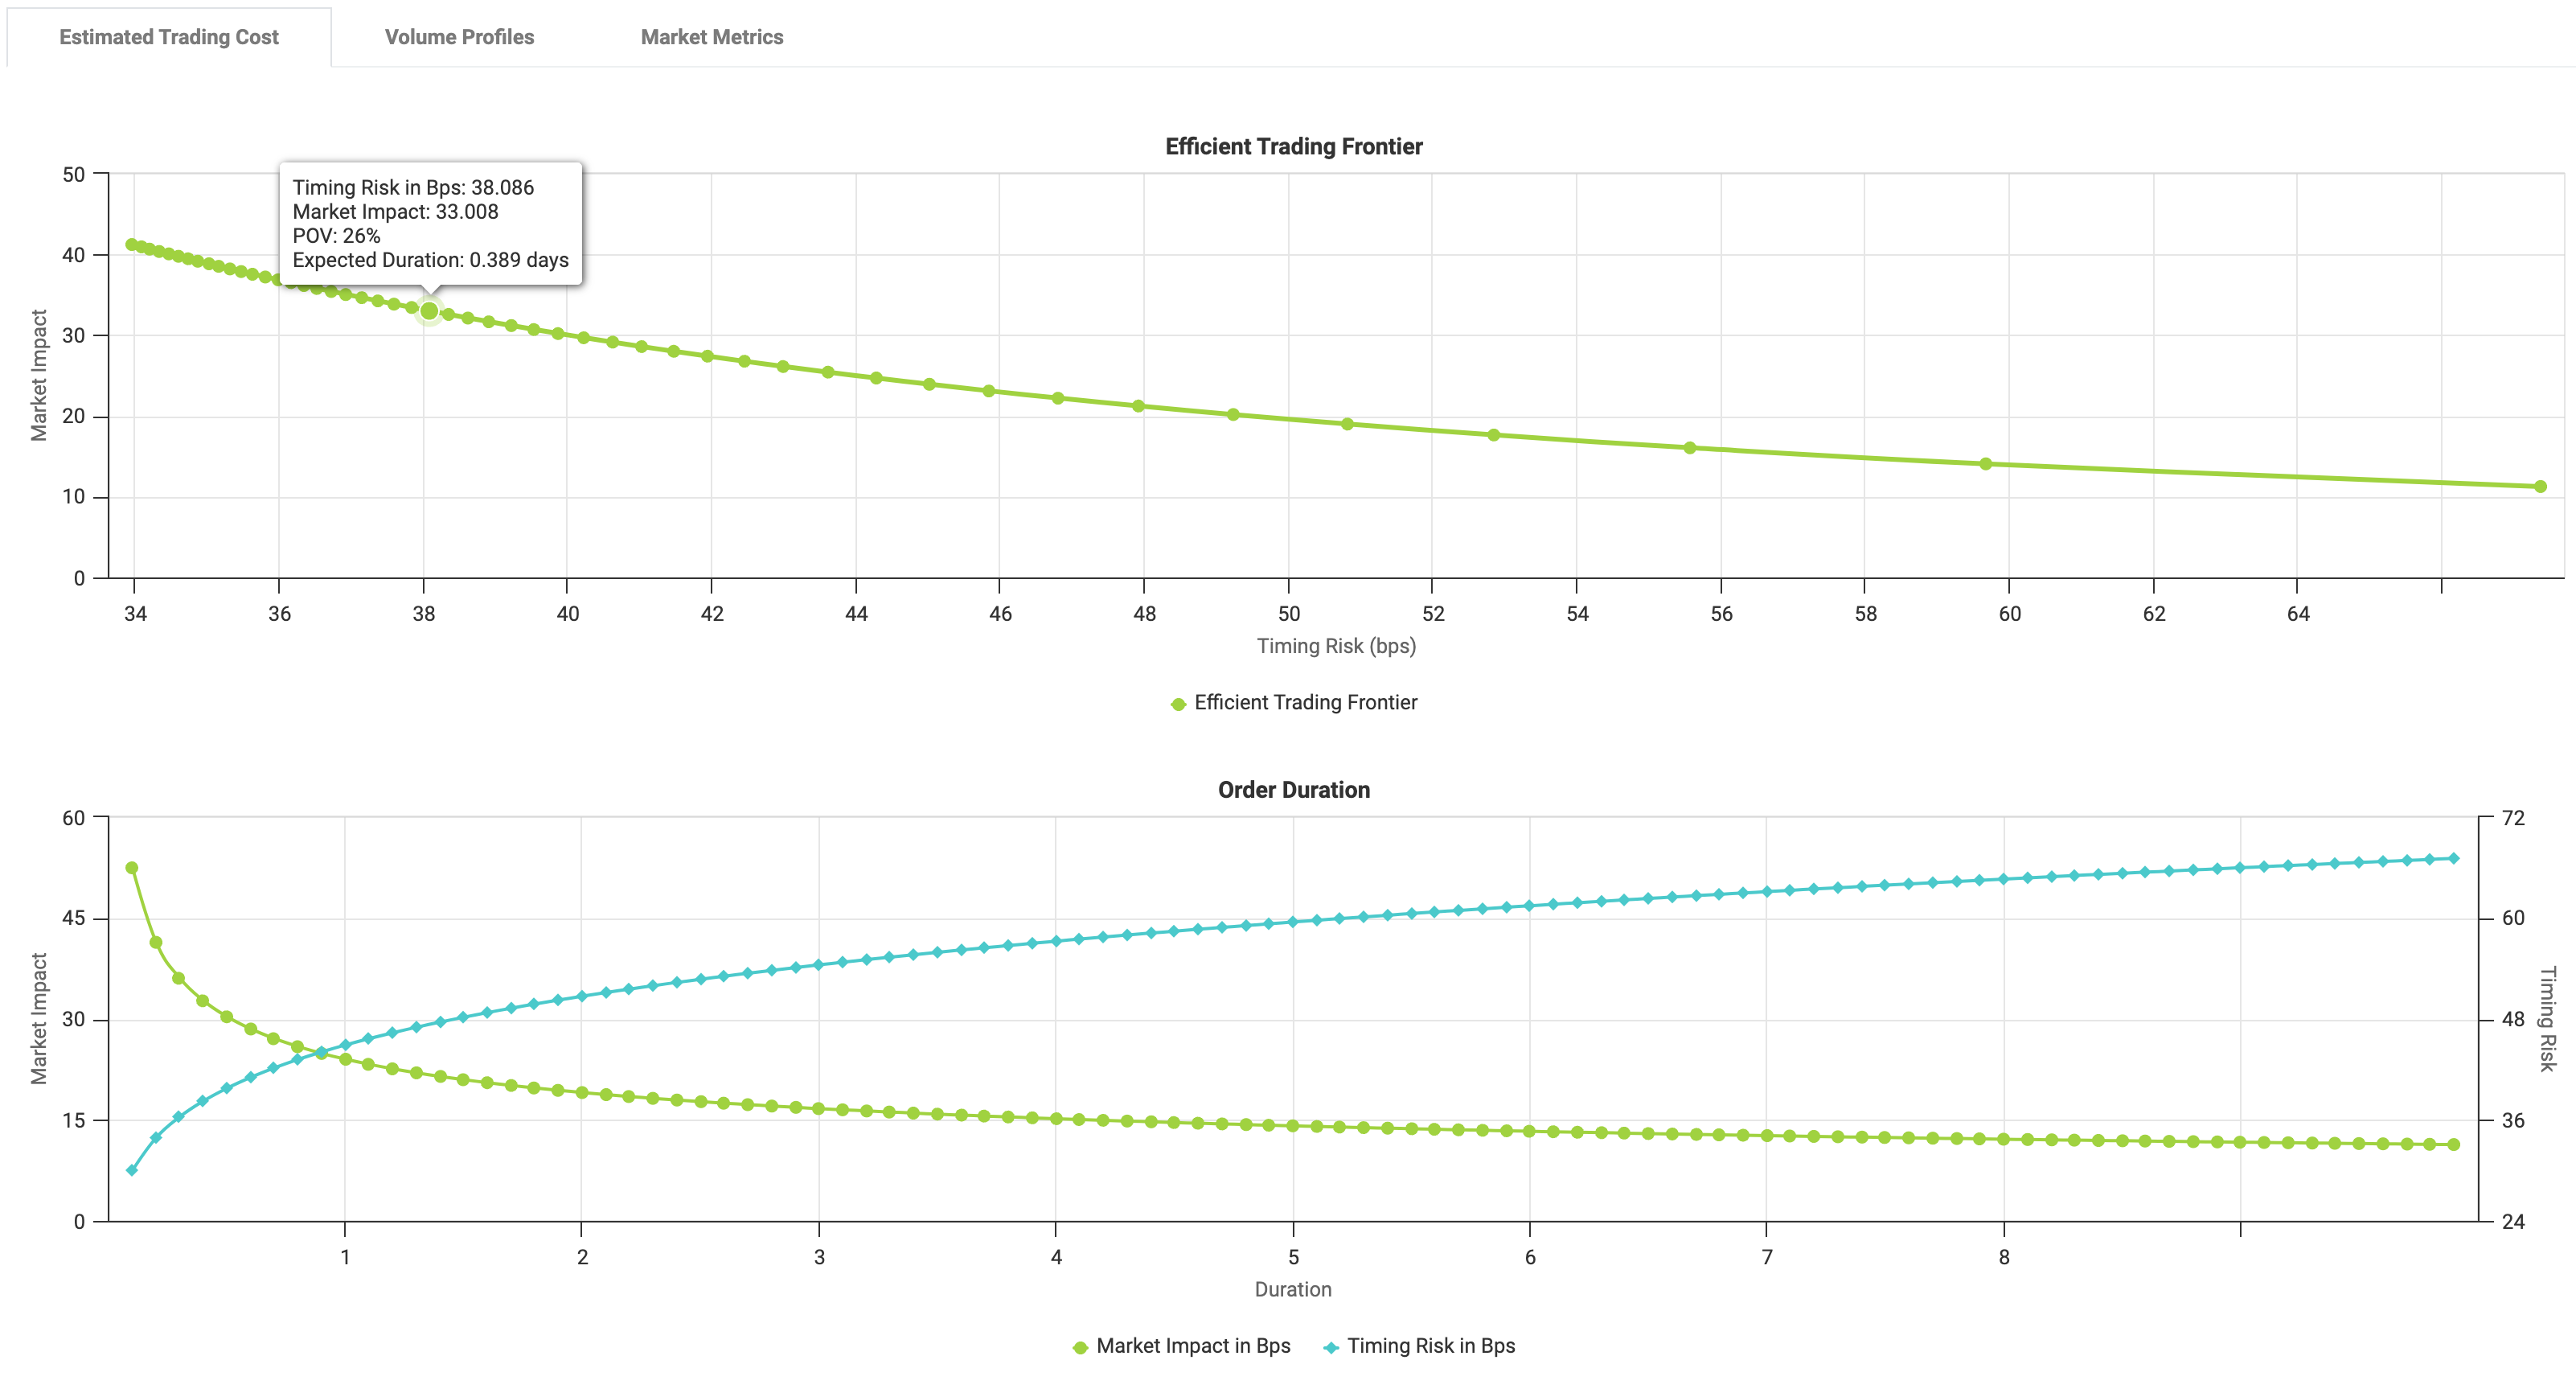
As shown in the graphs, the model creates an ‘Efficient Trading Frontier’, where the optimal participation rate represents a neutral trade-off between time in the market and volatility. Pop up ‘Tool Tips’ give the user greater detail on the visualisation and a tabular presentation is set out below showing the expected costs for a full range of participation rates. In this case, we can see that a Percentage of Volume (POV) strategy of 26% is expected to have a price impact (market impact) of 32bps and carries a timing risk (a function of volatility and time in the market) of 38bps, and is estimated to take 0.389 of a day (a day is equal to one day of trading in the Regular Session). A slightly higher POV would increase market impact but reduce timing risk.
Volume Profiles
The JSE Trade Explorer displays the distribution of volumes in five minute time buckets over the course of the trading day. The volume curve is based on 20 days historical data and is updated following each trading day.
Let’s Take An Example
In the example below, we can see the volume profile for NPN.
Intraday Volume and Volatility Curve for ANH.J
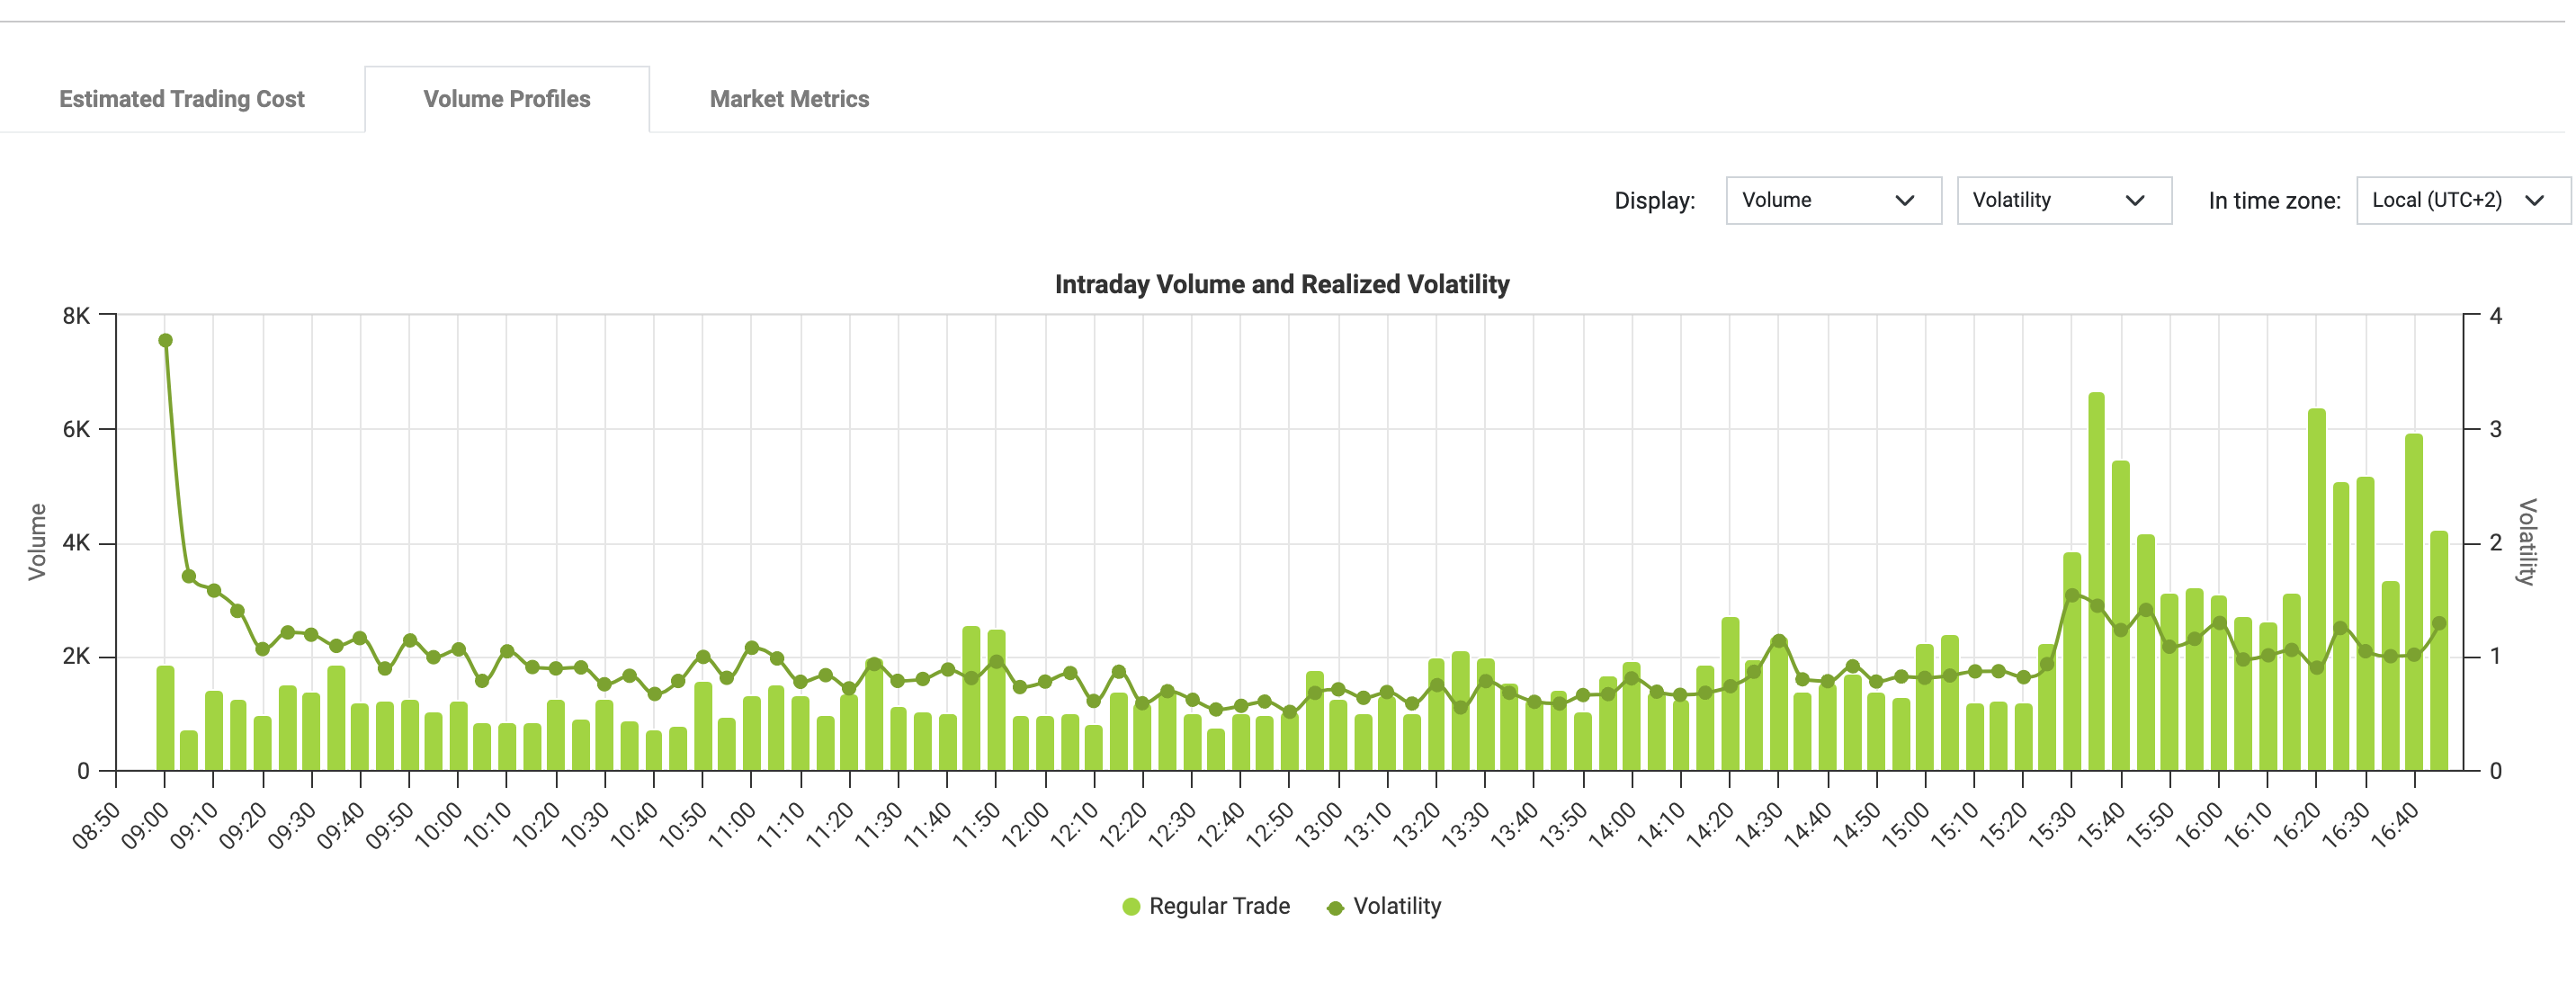
The bars show average volume for each five minute time bucket for the intraday session (the Close is not included). The line shows the volatility curve (also based on 20 days of historical data). We see how volatility is closely related to volumes, how it is highest immediately after the Open, and gradually reduces before another spike just prior to the Close.
The filters above the chart allows the user various options:
- Volume can be displayed either in shares or value
- Distribution of trade count, or average trade sizes (instead of volumes)
- The volatility curve can be replaced with effective spreads
- The timezone selected may be local or UTC
In the application you can see how the Effective Spread metric shows a similar pattern to volatility, with a clear trend towards lower trading costs later in the day.
Understanding these patterns helps traders to optimise their strategy by selecting the most liquid and least volatile times of day, when impact costs are more predictable.
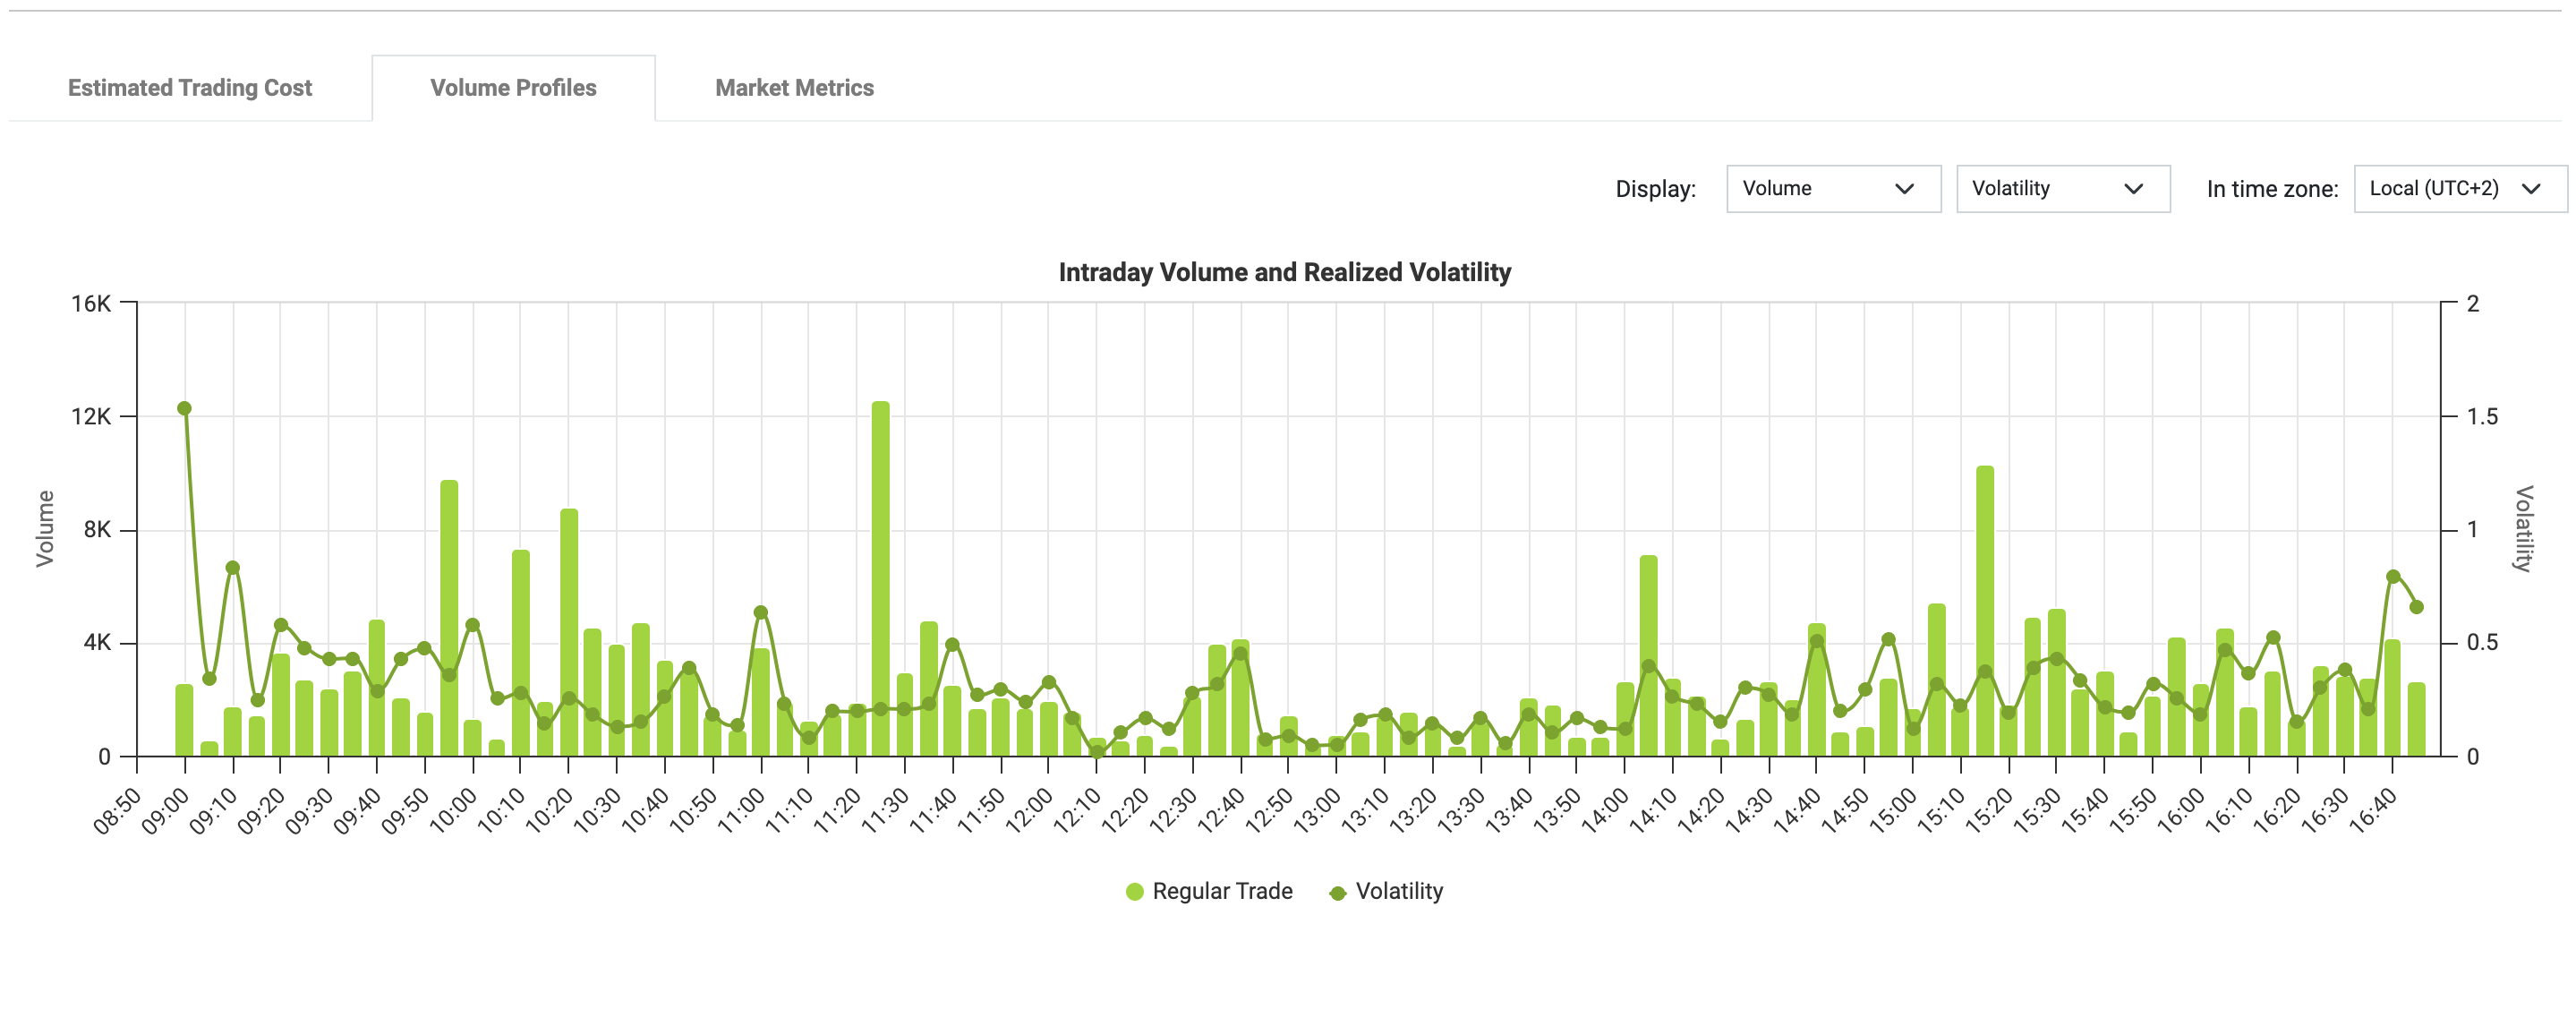
ANH.J shows a fairly even distribution over the day up to the mid-afternoon where there is a significant increase in volume. Our second chart on the next page shows the mid cap OMN, which has lower volatility than ANH.J but less predictability and some large volume spikes, more typical of less liquid names.
Once again, being aware of recent patterns is essential to optimising trade performance, especially in small and mid-cap names, which by nature have highly variable characteristics.
Intraday Value and Volatility Curve for Omnia Holdings Ltd.
For More on Pre-Trade Analytics
Please visit the Resources section in the footer of the JSE Trade Explorer to view the full Explainers series and discover more about Pre-Trade Analytics.
Feedback, Suggestions and Support
Please send feedback, questions or issues to [email protected] or use the form on the “Contact Us” link in the footer of all user views. We would appreciate as much information as possible such as:
- name of the window,
- any non-default filter settings,
- date range,
- symbol or stock selected.