This note is the first in a series of user guides and tips to help you familiarise yourself with the JSE Trade Explorer website. In further topics, we provide insights into the site content, covering the main features and analytics that are available.
Resources, Frequently Asked Questions and Methodology
First of all, please note the links to various Resources at the foot of each page. Here you will find user guides in sections under the headings, Frequently Asked Questions Methodology. The latter provides details on how the metrics are built, including the formulas and the scope of data used. You can also generate an email to our support team.
Network Issues and Timeouts
If you see a red box with this message, it is most likely to be a network problem or a user session timeout.
Take the following steps:
- Refresh your browser. If you have automatically been logged out, the system will invite you to log back in.
- Check you have a working internet connection.
- Restart your browser.
If this has not resolved the problem, please send an email to the address shown in the box and we will investigate.
Data Availability
The data is refreshed overnight and is available by 7am SAST. The reference date shown through JSE Trade Explorer is the most recent trading day.
Using the Filters
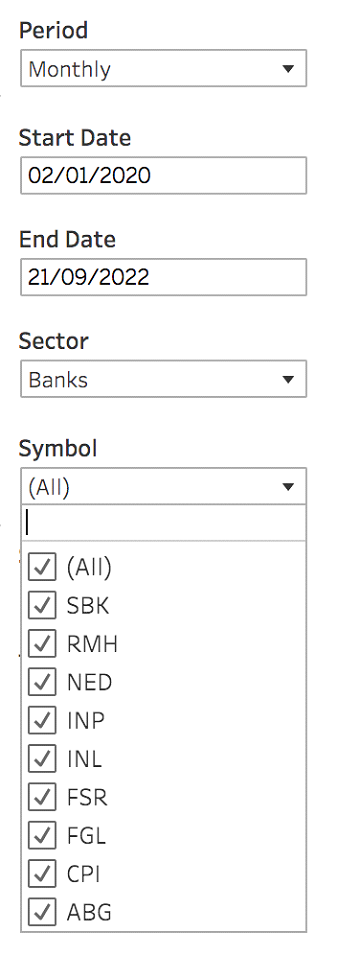
You will find filters on every view. They will help you navigate through the data and allow you to zoom in and out of various views using many different dimensions, such as time periods, dates, sectors, symbols, trade categories or trading segments.
You can pick one or more values in a filter to create your customised dataset and required level of detail. The filters initially default to the highest level of aggregation. The best way to return to the default view is to select “All”.
Note that the filters follow a hierarchy, so that the values you select are sometimes limited by your choices in other filters. The filters are themselves filtered so that if there is no data available for a given choice, it will not be displayed in the list.
For example, if you select the Sector “Banks”, you will only see those symbols belonging to the Banks Sector in the data. You can include or exclude some of those symbols to refine your view. If you then want to look at a symbol in another Sector, you must change both the Sector symbol to your desired choice and the Symbol filter. By selecting “All” you will reveal all choices available.
Sometimes, filters are used to change the view of the data that you see in a chart or the data in a grid, or to limit the number of datapoints that you can see in your selection. This may help to reduce information overload.
Using Peer Group and Whole Market Comparisons
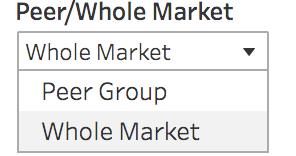
Throughout JSE Trade Explorer, you are able to compare the values attributable to your own trading with averages derived either from a Peer Group or the Whole Market. You can select which comparison you want to see using the filter.
Peer Groups are defined as the set of trading firms that most match your business activity. When computing averages, the system aggregates the data belonging either to a Peer Group or to the Whole Market depending on your filter selections, and displays both an average value, and your firm’s ranking within the selection. If the dataset available is too small, given the user selection, the system will display neither the average or the rank.
In addition, the system shows a Rank. When viewing Volume and Market Share information, the Rank reflects your firm’s ranking by ADV or market share. When viewing other analytics, the Rank value is a statistical ranking. You can find the definition in the Methodology section mentioned earlier.
The Peer Groups are initially set to include a large number of firms – this may change over time based on feedback from users.
Peer Groups and Rankings do not apply to Security Analytics.

Some Visuals Act as Filters
For some Graphs, you are able to use the visualisation to filter the data, including its legend. For example in the heatmap opposite, we can select “Basic Materials” and the Instrument ranking chart will automatically be filtered to show only symbols relevant to the Sector, as shown below.
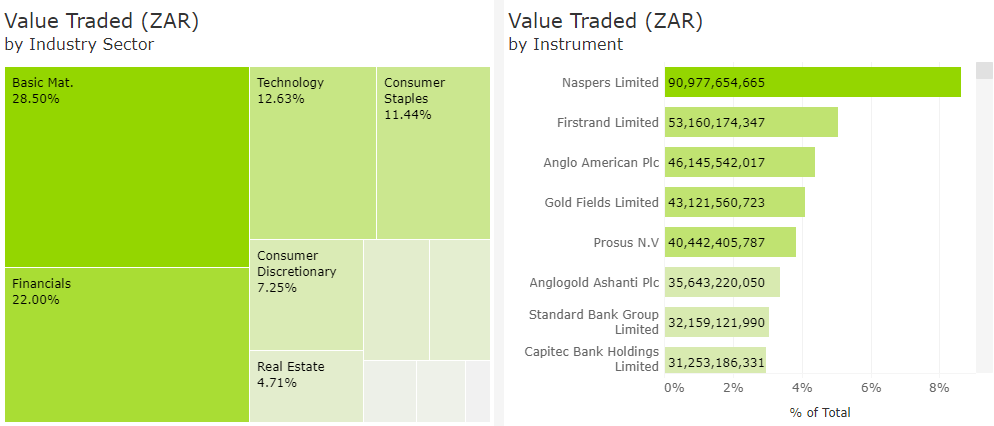
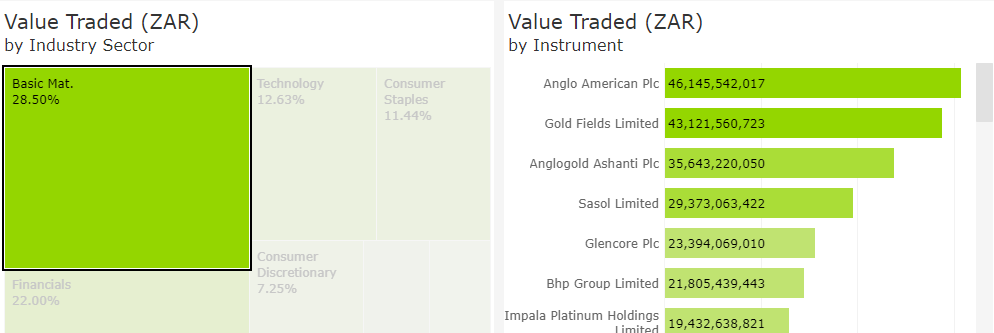
Click again to reset the filter back to the “All” setting. In the example below, when “Basic Materials” is selected from the Sector heatmap, the Instrument rank bar chart is changed.
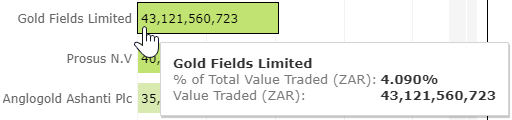
ToolTips
ToolTips are boxes that dynamically pop up when you move your mouse over a datapoint without clicking. They are a way of being able to provide precise values related to a measure without cluttering up the overall view.
Main Menu Headings and Features
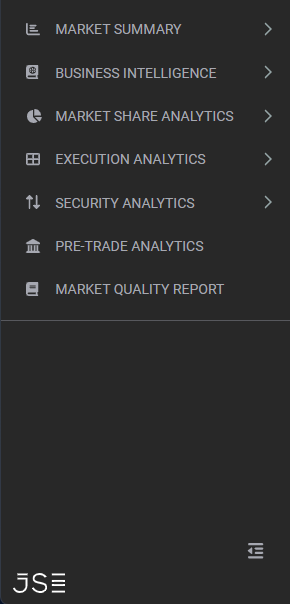
JSE Trade Explorer contains five main areas of functionality.
- Market Summary - a generic view of market volumes in several dimensions including trading segment, sector, symbol and trade types over time.
- Market Share Analytics - specific views of a Firm’s own position regarding volumes and market share, with comparisons to anonymised Peer Groups.
- Execution Analytics - a suite of metrics based on a Firm’s own orders and trades, designed to help users to better understand their trading patterns.
- Security Analytics - as for Execution Analytics except based on generic public data, designed to provide insights into the way in which a share trades.
- Pre-trade Analytics - a single stock pre-trade tool that allows a trader to assess the expected impact of an order given certain participation levels.
We encourage you to explore each of the sub menus. Please look out for other notes in our Explainers series which will also be available in the Resources section of the website to help familiarise you with the basic concepts and features of the application.
How To Access the Service
If you are an existing user of the JSE Trade Explorer, please follow this link and login using your existing credentials: https://jse.big-xyt.com/login
If you are a new user, please register for the service by following this link https://jse.big-xyt.com/signup and follow the instructions.
Feedback, Suggestions and Support
Please send feedback, questions or issues to [email protected] or use the form on the “Contact Us” link in the footer of all user views. We would appreciate as much information as possible such as:
- name of the window,
- any non-default filter settings,
- date range,
- symbol or stock selected.